

Comparative Analysis of Monthly Reports on the Oil Market
1. International Policy and Market Context
Natural gas and nuclear energy included in EU green taxonomy
- On 2 February, the EU presented the Taxonomy Complementary Climate Delegated Act that amends the existing Act, which came into force on January 1, 2022. When adopted, the EU guidelines will set a standard for sustainable financing that acknowledges natural gas and nuclear. Private investors will have EU backing to invest in natural gas and nuclear projects based on stringent conditions and transitional arrangements.
Energy prices surge in a new risk environment
- Oil prices hit $90 for the first time since 2014 while coal prices in Asia surged to a record high of over $200 per tonne according to IHS and Argus. European natural gas prices, meanwhile, remain volatile. Though they have come down from December highs, natural gas prices remain elevated on account of supply side risk. A combination of factors including a return of pent-up demand, low storage constraints, bottlenecks, and rising geopolitical tensions are seeing energy prices and inflation rise.
US refined product demand hits record-high
- U.S. crude oil stockpiles fell as overall refined product demand reached an all-time record according to the EIA. Crude inventories fell 4.8 million barrels in the week of February 4 to 410 million barrels – their lowest for commercial inventories since October 2018.
25th OPEC and non-OPEC Meeting reaffirms production adjustments
- On 2 February, OPEC and non-OPEC countries reconfirmed the production adjustment plan and the monthly production adjustment mechanism approved at the 19th OPEC and non-OPEC Ministerial Meeting on 18 July. OPEC-plus Ministers decided to adjust the monthly overall production by 0.4 mb/d for the month of March The 26th OPEC and non-OPEC Ministerial Meeting is scheduled for 2 March 2022.
2. Key Points
2.1 Demand
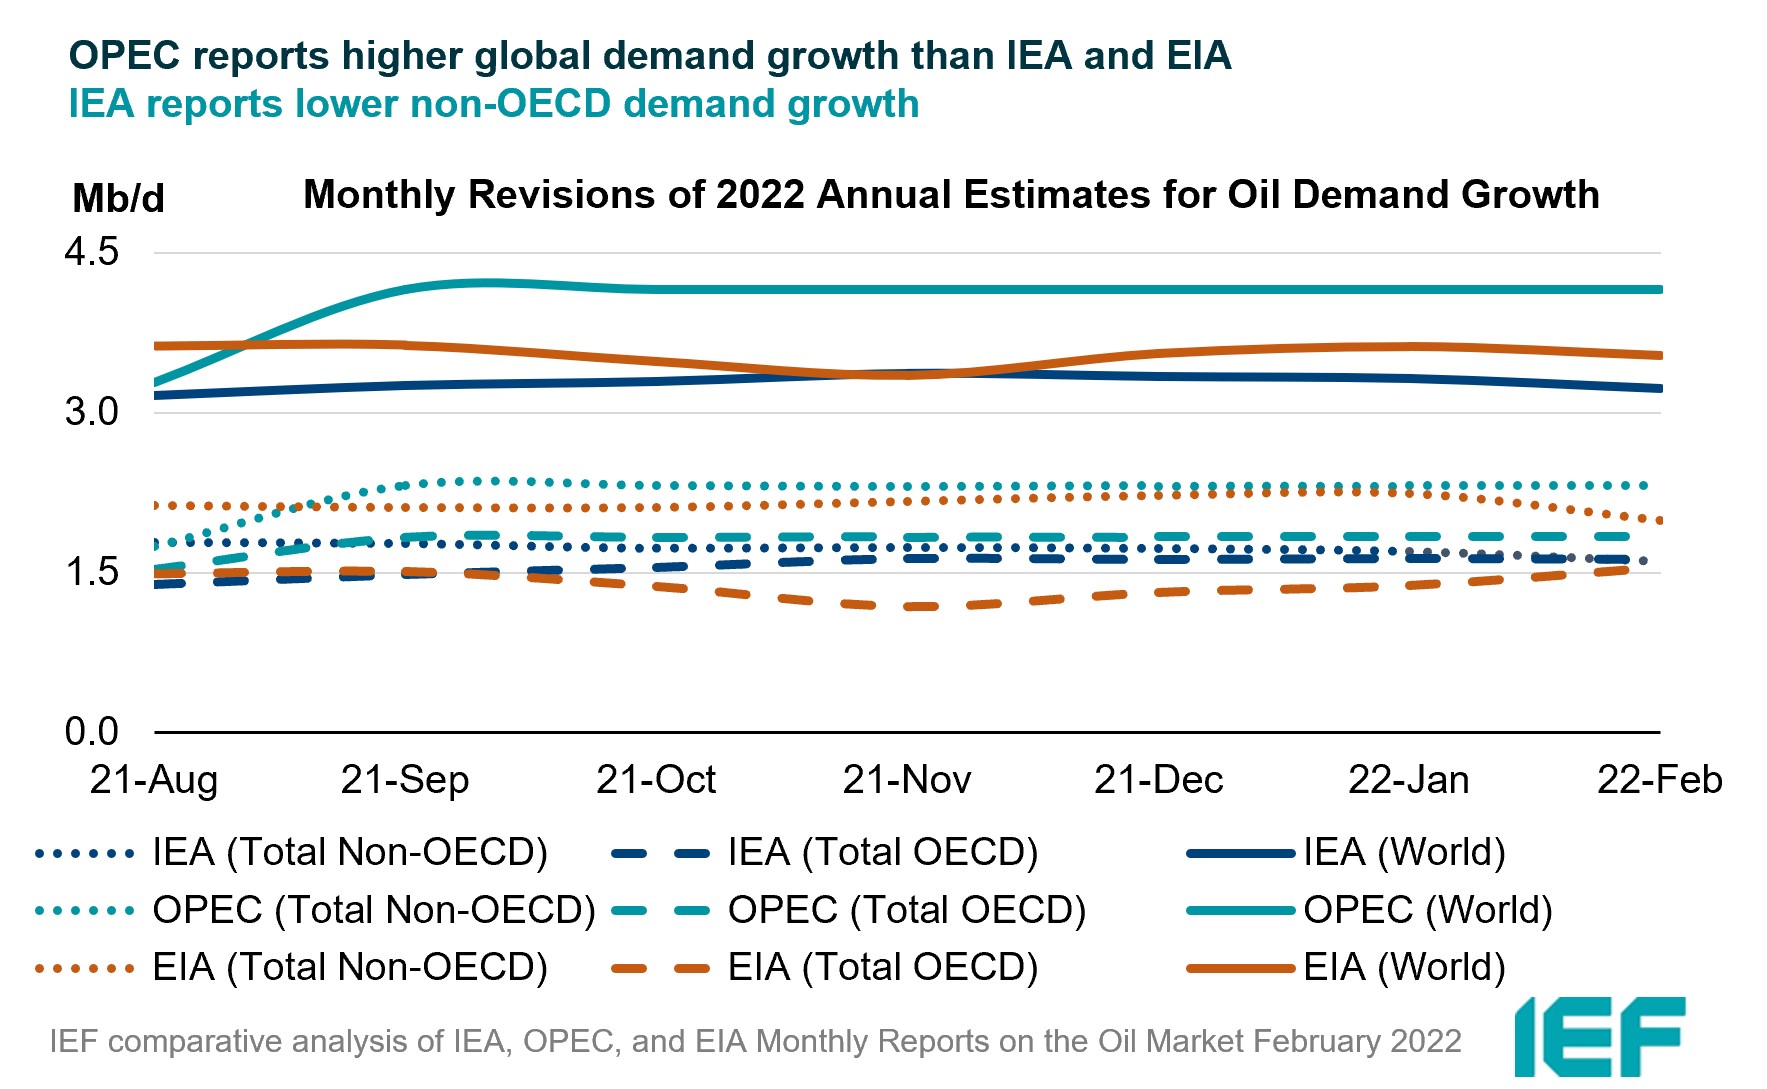
OPEC reports more demand growth than IEA and EIA in 2022.
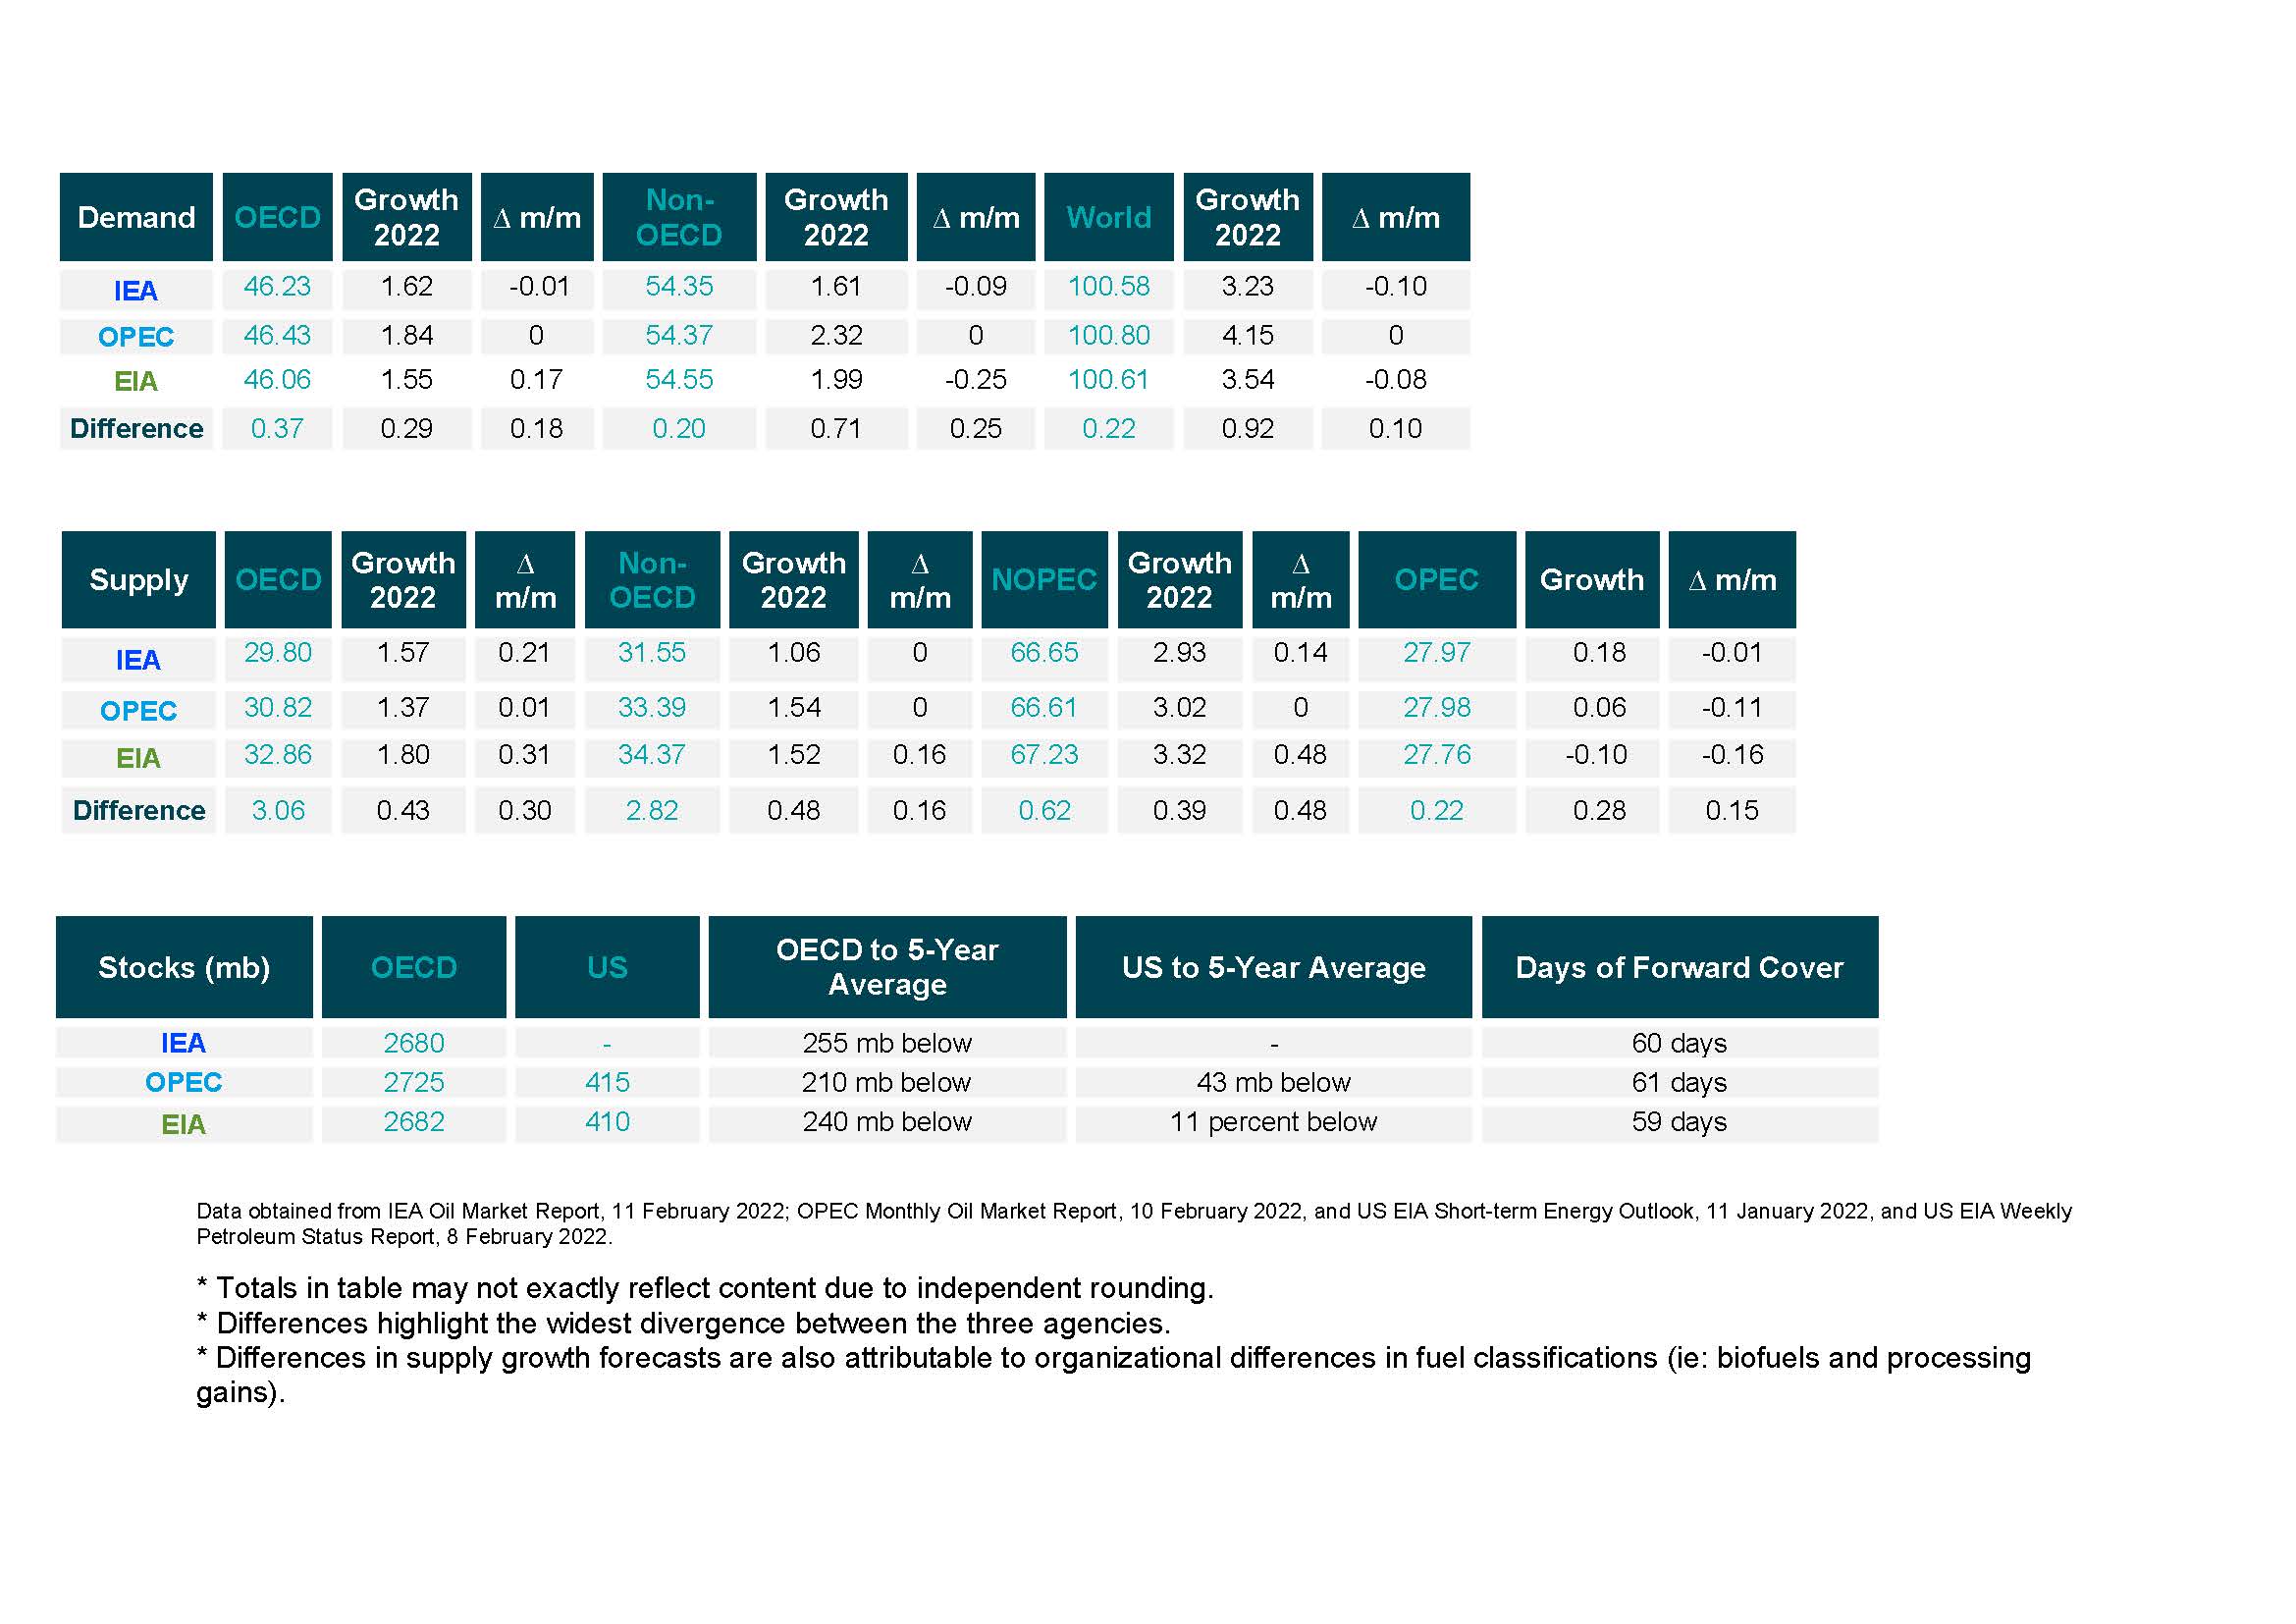
- IEA's demand growth assessment falls year-on-year (y-o-y) by 100 kb/d to 3.23 mb/d for 2022.
- OPEC's y-o-y forecast remains the same at 4.15 mb/d.
- EIA's assessment falls by 80 kb/d for a growth of 3.54 mb/d this year. The IEA, OPEC, and EIA estimates for absolute world demand are now 100.58 mb/d, 100.80 mb/d, and 100.61 mb/d for 2022, respectively.
The IEA, OPEC, and EIA converge on OECD demand growth but differ on non-OECD demand growth in 2022.
- The IEA's assessment of y-o-y non-OECD demand growth falls by 90 kb/d to 1.61 mb/d, while OPEC's estimate remains the same at 2.32 mb/d. EIA non-OECD demand growth falls by 170 kb/d for a growth of 1.99 mb/d.
- The IEA's estimate for OECD demand falls slightly by 10 kb/d to 1.62 mb/d for 2022 while OPEC's projection remains the same at 1.84 mb/d. EIA sees OECD growth falling by 250 kb/d reaching 1.55 mb/d this year.
- OPEC/EIA and OPEC/IEA assessments of OECD and non-OECD demand growth differ by 290 kb/d and 710 kb/d, respectively.
2.2 Supply
EIA and IEA forecast higher non-OPEC supply growth in 2022 while OPEC estimate remains unaltered.
- The IEA's February assessment for non-OPEC supply reaches a growth of 2.93 mb/d while OPEC's estimate remains the same at 3.02 mb/d. The EIA reports the highest growth out of the three organizations at 3.32 mb/d, a revision of 480 kb/d from last month. In absolute values, the IEA, OPEC, and EIA estimate non-OPEC supply at 66.65 mb/d, 66.61 mb/d, and 67.23 mb/d, respectively for 2022.
- The IEA estimates OECD oil supply growth this year at 1.57 mb/d, OPEC pegs it at 1.37mb/d, and EIA reports growth at 1.80 mb/d, an increase of 210 kb/d, 10 kb/d, and 310 kb/d, respectively. In absolute terms, the IEA, OPEC, and EIA estimate OECD oil supply at 29.80 mb/d, 30.82 mb/d, and 32.86 mb/d, respectively for 2022. The difference between OPEC and EIA on OECD supply growth is 430 kb/d.
OPEC and EIA report higher non-OECD supply growth than the IEA.
- OPEC's and EIA forecast non-OECD supply growth assessments remain close at 1.54 and 1.52 mb/d, respectively while the IEA ‘s growth projection is unchanged at 1.06 mb/d.
- In absolute values, the IEA, OPEC, and EIA non-OECD supply estimates are 29.80 mb/d, 30.82 mb/d, and 32.86 mb/d, respectively for 2022 with the highest divergence in growth between EIA and OPEC at 430 kb/d.
The IEA and OPEC revise OPEC production estimates upwards while EIA revises this downwards for January.
- The IEA revised its OPEC production estimate upward by 180 kb/d month-on-month (m-o-m) to reach total production of 27.97 mb/d. OPEC's assessment of its own production was revised upwards by 60 kb/d to 27.98 mb/d. The EIA also decreased its assessment by 100 kb/d for total OPEC crude production of 27.76 mb/d.
2.3 Stocks
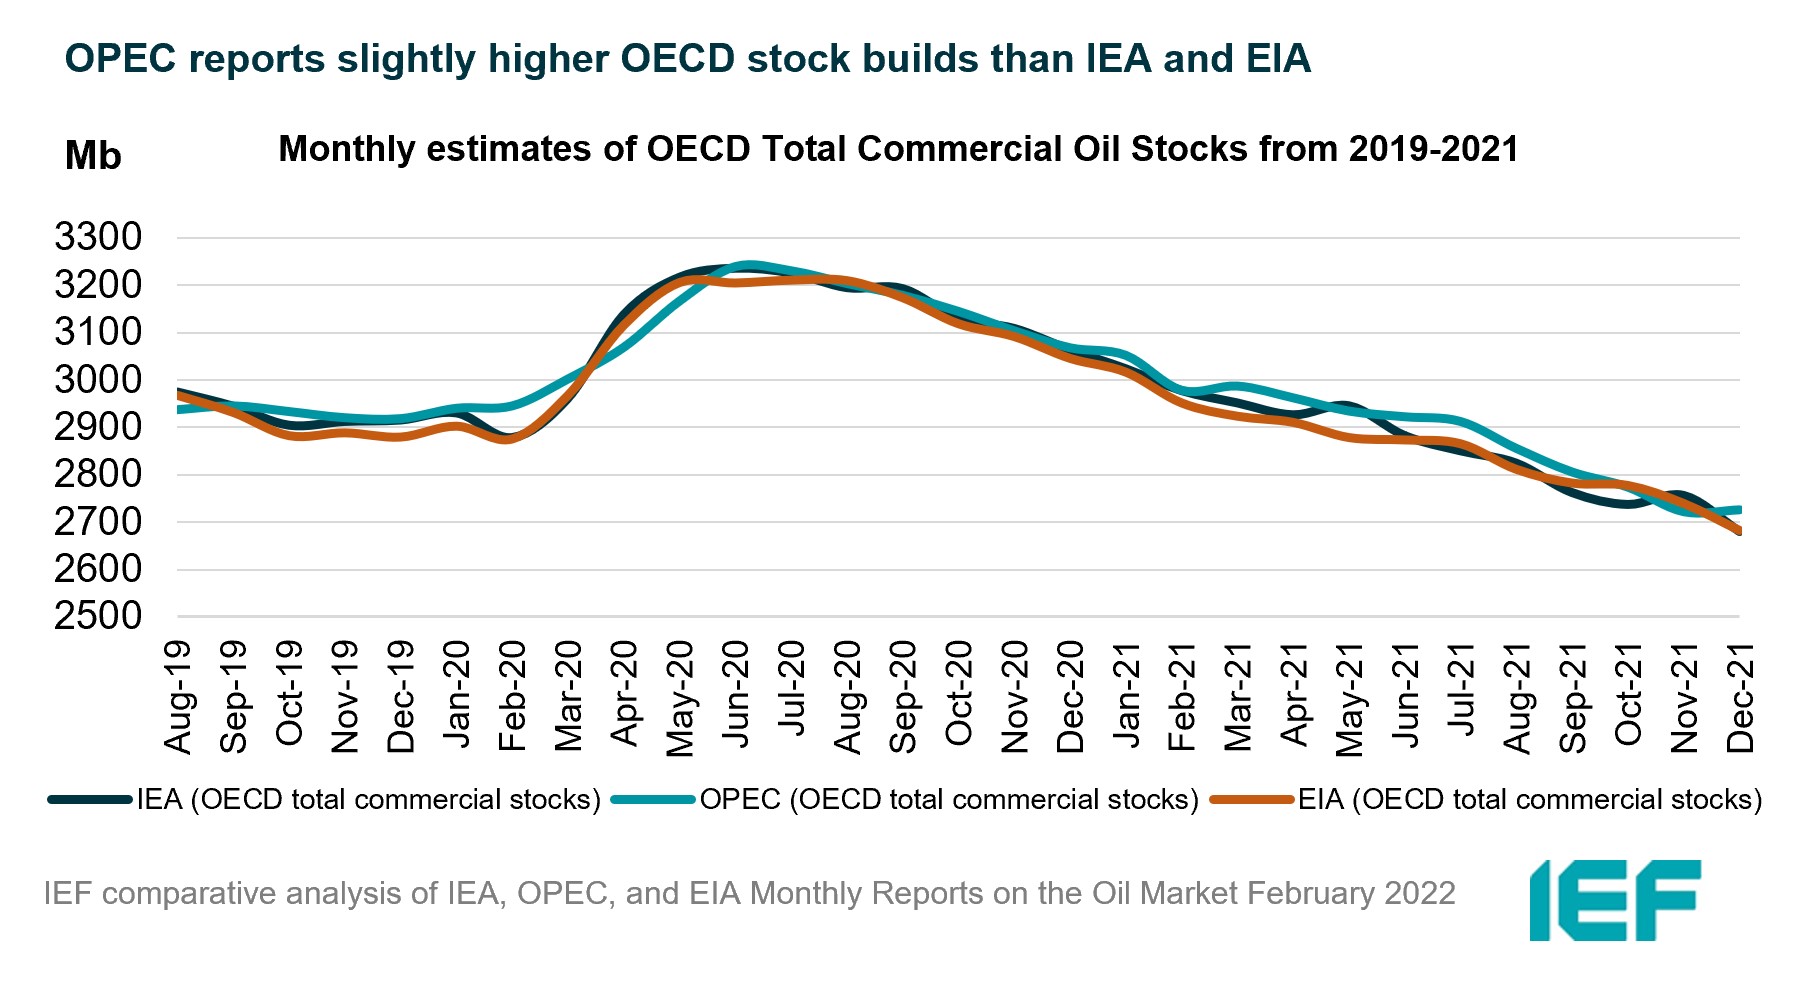
The IEA, OPEC, and EIA continue to display strong alignment on stock figures which are now below the five-year average but still close to or higher than 60 days forward cover.
- The IEA reports OECD stock levels at 2680 mb, which is close to OPEC's assessment of 2725 mb and EIA's assessment of 2682 mb. These are around 255 mb, 210 mb, and 240 mb below the five-year average, respectively.
- According to the IEA, crude oil inventories built by 18.5 mb while product stocks drew by 30.8 mb. Other oils, including NGLs and feedstocks drew by 10.7 mb. According to OPEC, crude oil stocks drew by 18.3 mb while products drew by 12.9 mb.
- EIA estimates OECD inventories dropped by 51 mb in December to 2682 mb – 240 mb below the five-year average.
- The widest divergence in inventories is between the IEA and OPEC which stands at 45 mb. Total US crude inventories (excluding SPR) amount to about 410 mb, according to the EIA, which is 11 percent below the five-year average for this time of year. OPEC reports US commercial crude oil stocks at about 415 mb and around 43 mb below the five-year average.
2.4 Snapshot (mb/d)
3. Global Analysis
3.1 Demand Data
3.2 Supply Data

3.3 Stock Data

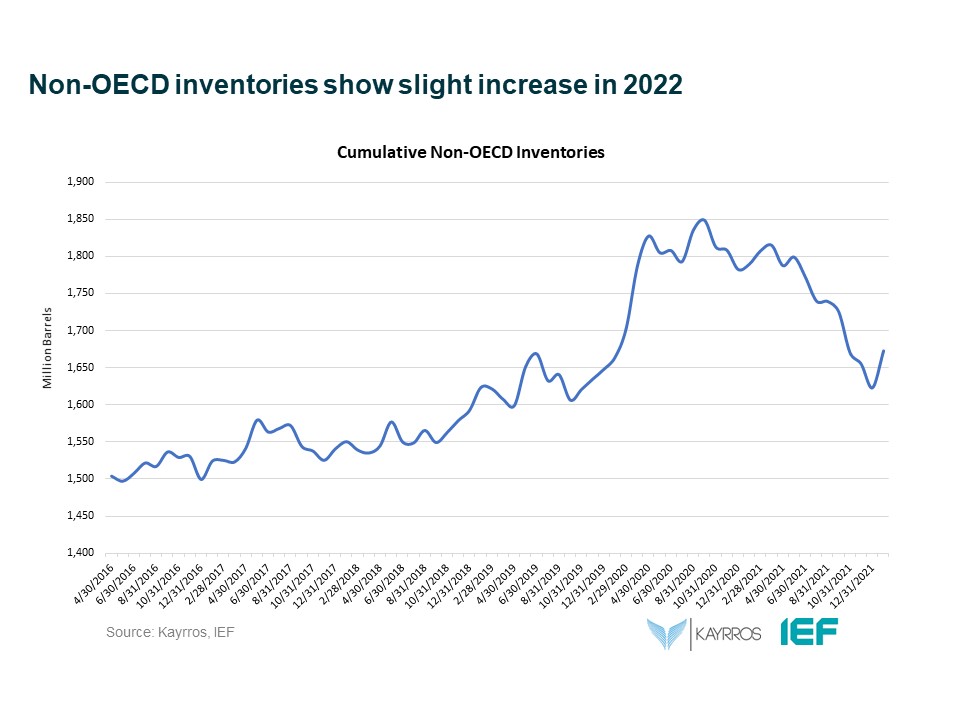
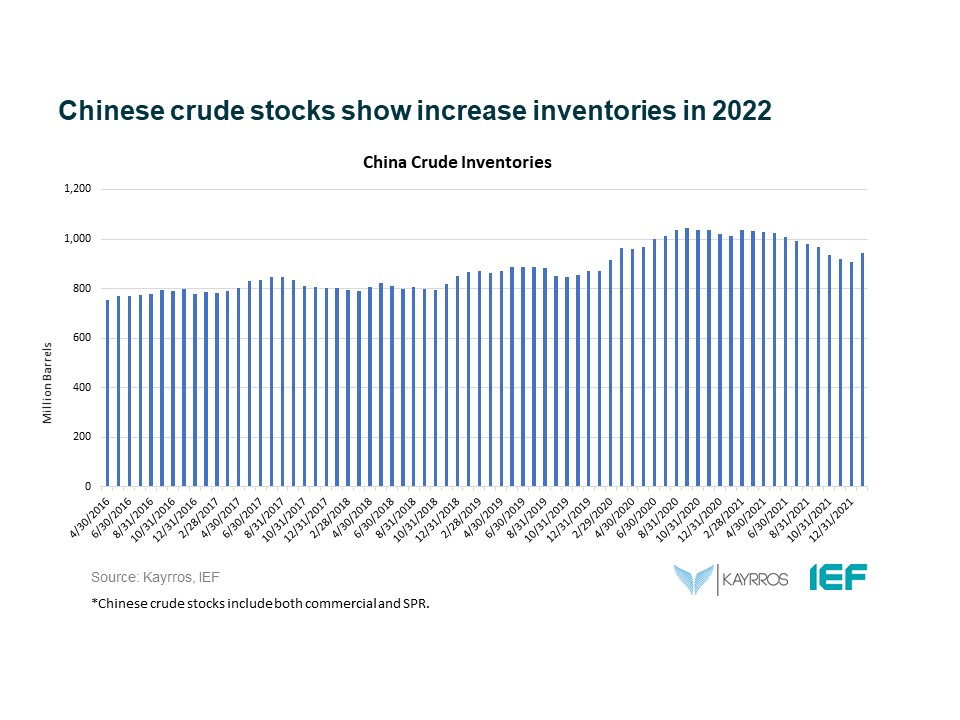
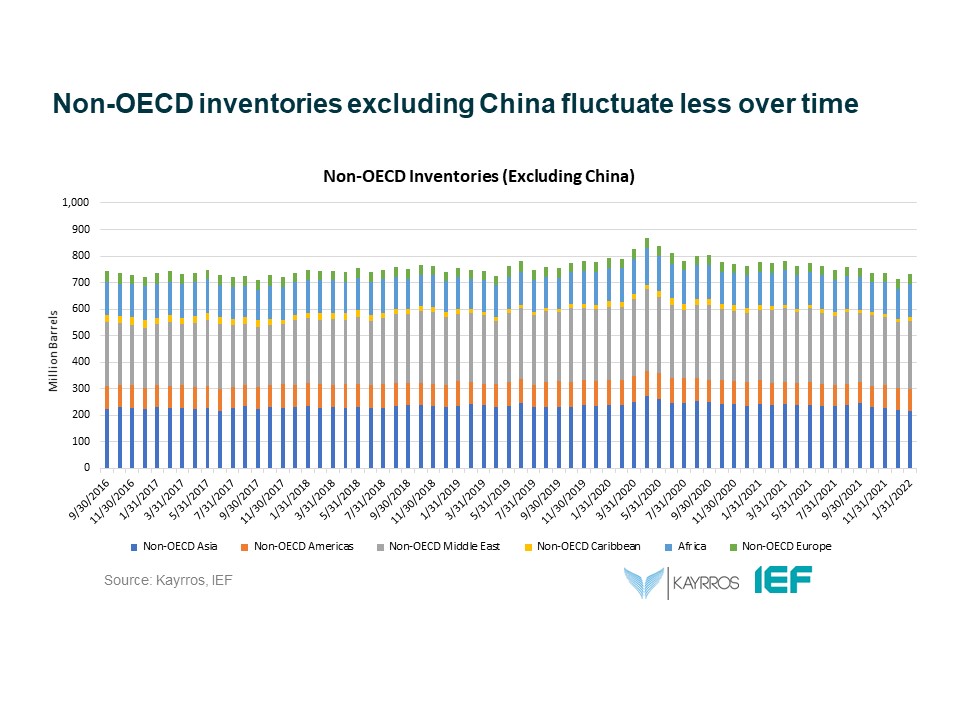
IEF-Kayrros Stock Analysis:
JODI Data:
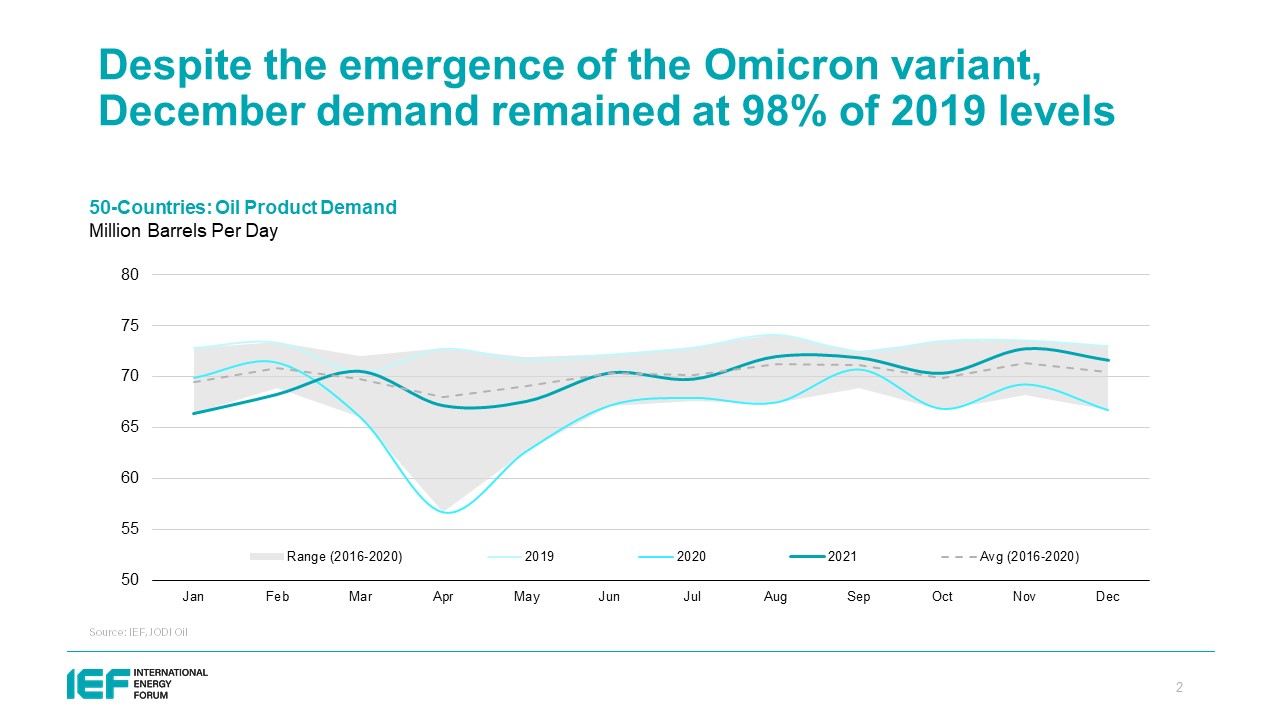
Despite the emergence of the Omicron variant, December demand remained at 98% of 2019 levels.
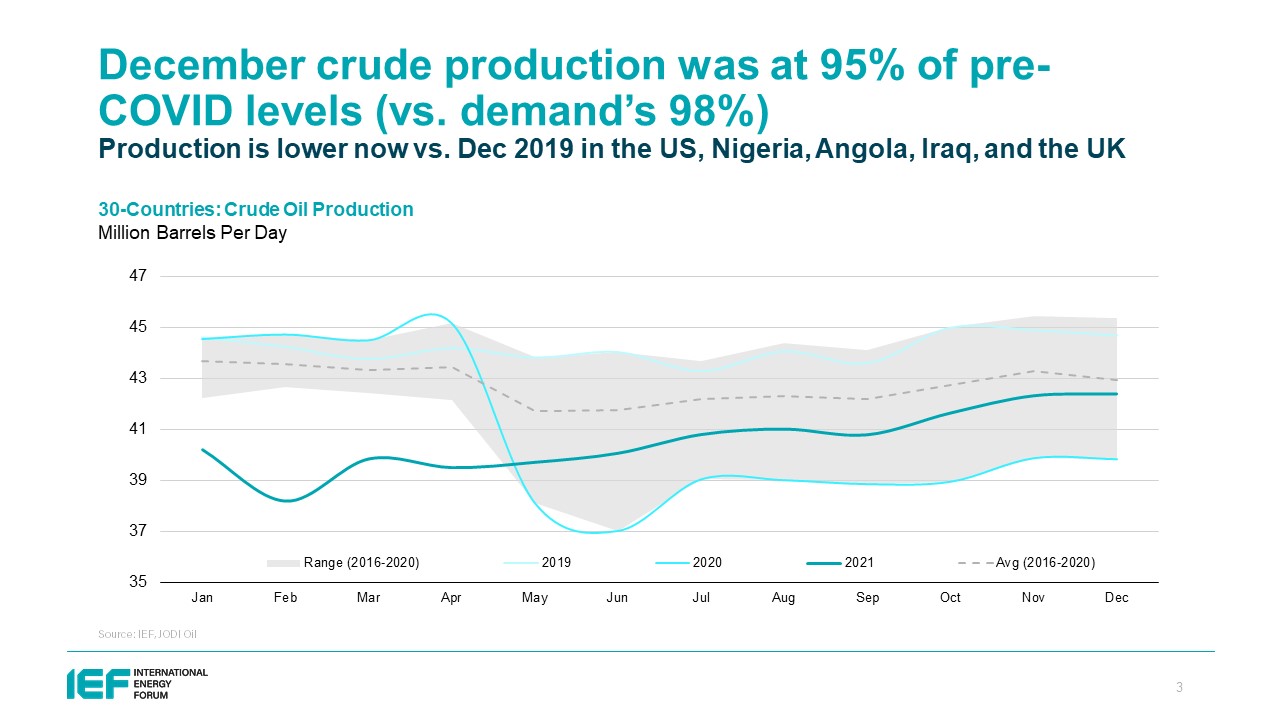
December crude production was at 95% of pre-COVID levels (vs. demand’s 98%). Production is lower now vs. Dec 2019 in the US, Nigeria, Angola, Iraq, and the UK.
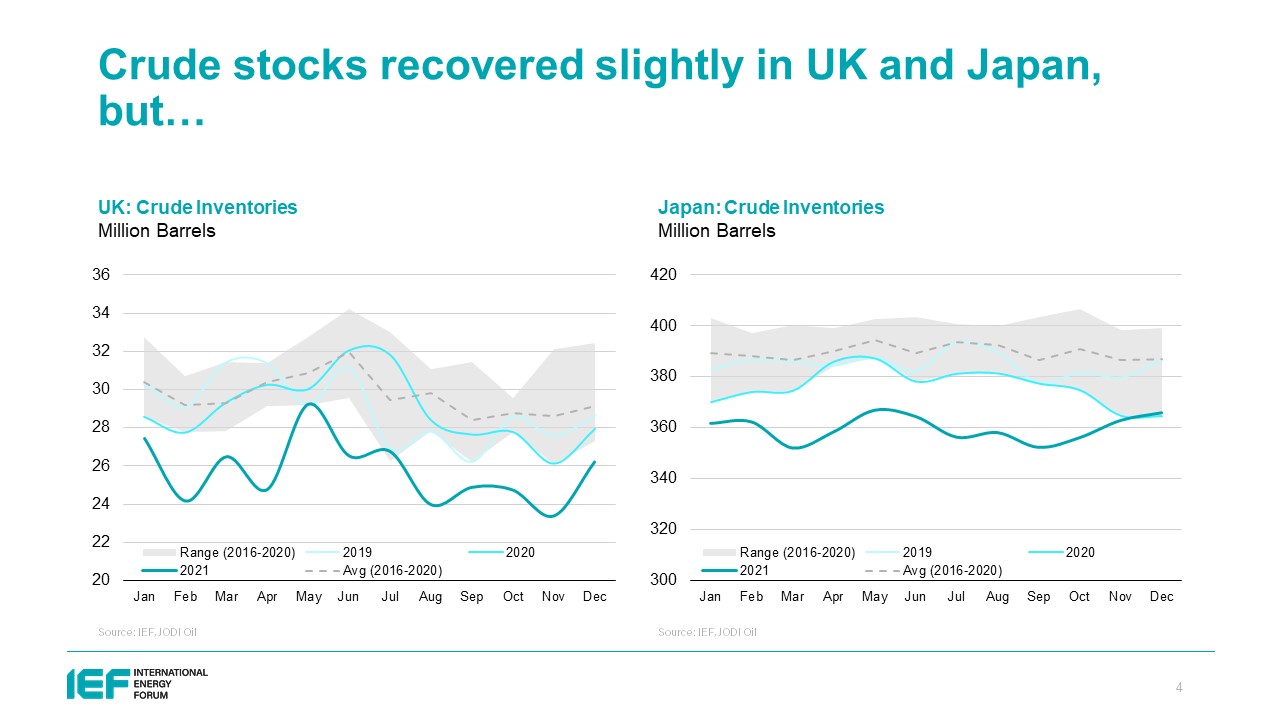
Crude stocks recovered slightly in UK and Japan, but...
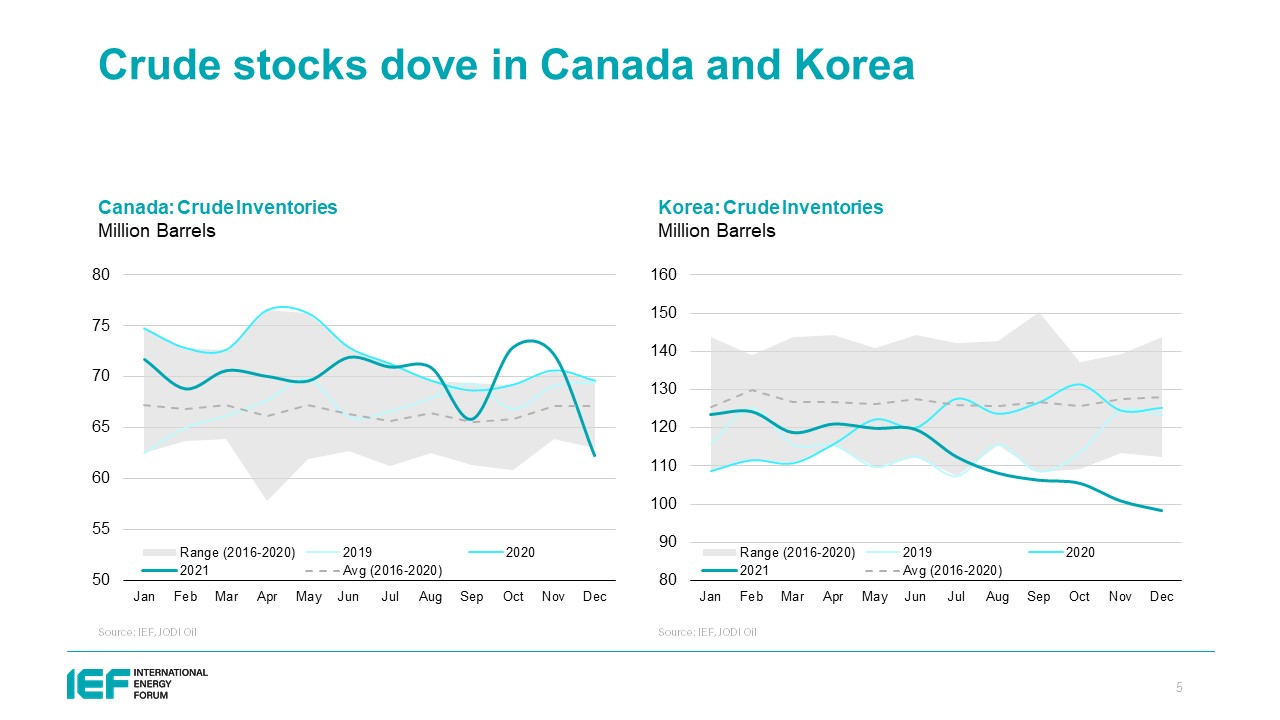
Crude stocks dove in Canada and Korea.
Explanatory Note
The IEF conducts a comprehensive comparative analysis of the short-, medium-, and long-term energy outlooks of the IEA, OPEC, and the EIA to inform the IEA-IEF-OPEC Symposium on Energy Outlooks that the IEF hosts in Riyadh as part of the trilateral work programme on a yearly basis.
To inform IEF stakeholders on how perspectives on the oil market of both organisations evolve over time regularly, this monthly summary provides:
- An overview of key events and initiatives in the international policy and market context.
- Key findings and a snapshot overview of data points gained from comparing basic historical data and short-term forecasts of the IEA Oil Market Report, the OPEC Monthly Oil Market Report, and the EIA Short-term Energy Outlook.
- A comparative analysis of oil inventory data reported by the IEA, OPEC, and EIA, and secondary sources in collaboration with Kayrros (added in an updated report on the IEF website).
The International Energy Forum
The International Energy Forum is the leading global facilitator of dialogue between sovereign energy market participants. It incorporates members of International Energy Agency and the Organization of the Petroleum Exporting Countries, and also key players including China, India, Russia and South Africa. The forum's biennial ministerial meetings are the world's largest gathering of energy ministers, where discussions focus on global energy security and the transition towards a sustainable and inclusive energy future. The forum has a permanent secretariat of international staff based in the Diplomatic Quarter of Riyadh, Saudi Arabia. For more information visit www.ief.org.